Steps 3: Interactive reports and widgets
The information is structured by 6 tabs: Overview, Descriptors, Indicators, Data Elements, Constants and Sensors and Video cameras. Each tab allows information related to its category.
Overview of the features in short video
Tab Overview has information about current state of the object and its sub objects if any. It has multiple visions of the enterprise in pictures, video, maps, plans, diagrams, dependencies, etc. There are widget icons in the upper left corner (under the name of the tab Overview) providing additional information such as Summary for the object, Tags, History of object state change, Maps/Plans and Dependencies.
Tab Descriptors presents custom description of object properties related to the particular object.
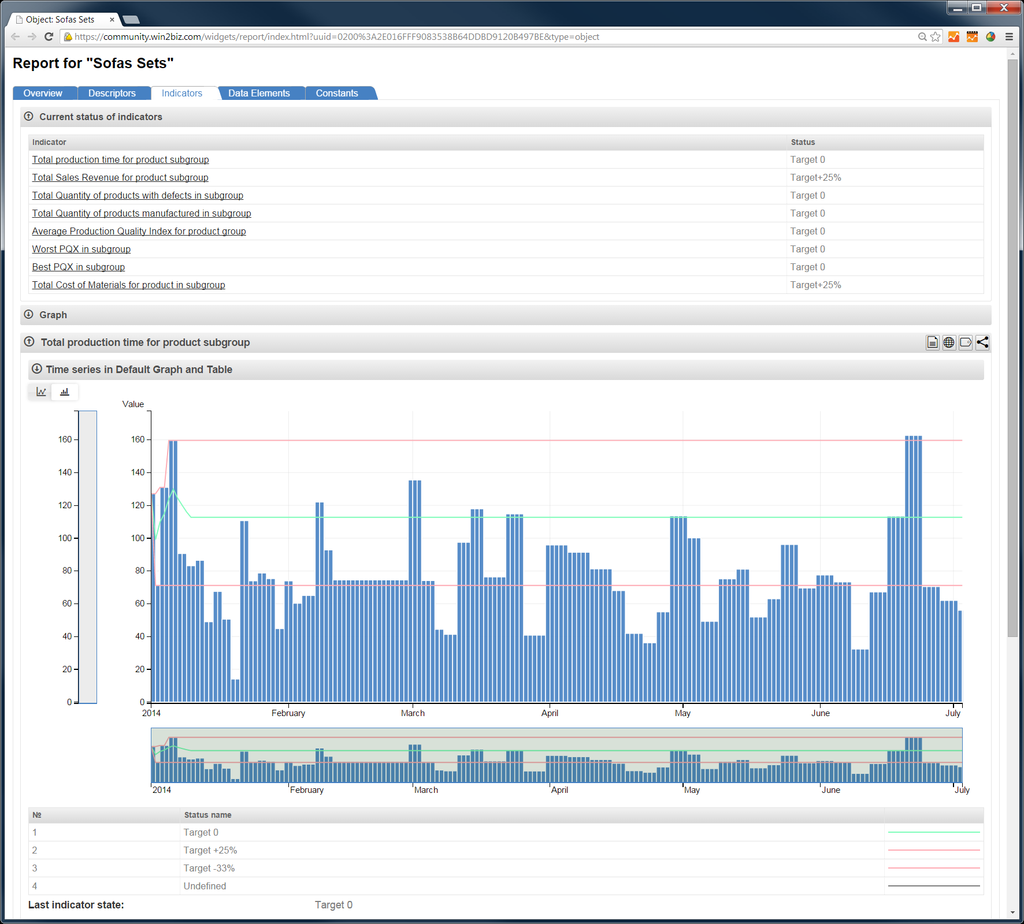
Tabs Indicators and Data Elements present charts and tables of time series for the analysis. Each indicator and data element has own icons providing additional information details in summaries, dependency graphs and selected charts/tables of values.
The information is updated in near real time if the report is opened in your browser.
In their system installations the users can change and customize any of application properties by themselves i.e. Names, Descriptors. Summaries, Indicators and its formulas, Data elements and source databases, Constants, Pictures, Sensors, etc.
You are welcome to play with Smart Enterprise demo model online.
Note that the enterprise model installation is automatic and made accordingly to the subscription for the engine. It can be used as open template to adapt it your own enterprise model by for quick modification of settings and be connected to relevant enterprise data sources and run in real time.
Run Smart Enterprise Monitor demo online
2026 © GOLEM IMS GMBH, Austria. ALL Rights Reserved.
Terms of Service |
Privacy Policy
Made in Austria